
COVID-19: The uncertainty of the data and the importance of mild or asymptomatic cases
Since the beginning of COVID-19 pandemic, we have been overwhelmed by numbers, data and statistics. Right, but what do these statistics and data mean? What do they really tell us?
The truth is, it’s hard to know! When we study a phenomenon that it is still ongoing (like this pandemic), it is particularly difficult to capture the real meaning of the data, to read them correctly, and to judge their accuracy and precision. Because we do not yet have a complete picture of this situation, we have to make assumptions and some of them may prove to have been wrong, just as the eventual course of the epidemic may show us to have underestimated or overestimated the likely overall health impact. However, bearing in mind the limitations of the data and the need to read them carefully, it is still possible to comment on the data that we are seeing. A lot of people – epidemiologists and infectious disease modellers mostly – are helping us to understand the pandemic as it unfolds and to reflect in a well-informed way on the decisions taken by governments around the world.
Firstly, let’s define what the numbers are. In the news of the last days, we are seeing two main kinds of data-information: the projections and the observed data. The projections (usually) build in uncertainty and tell us within what range of values we should expect a measurable future outcome to fall. They also make use of different assumptions to define different scenarios, so that we can compare expected outcomes from a ‘business-as-usual’ strategy with strategies that deploy mitigating interventions of various kinds. Such comparisons as these often guide decisions about what to do.
The observed data, on the other hand, give us a cumulative headcount of individuals who have tested positive, the number of tests that have performed, as well as the proportion of those who required hospitalization or intensive care, and the numbers of deaths. These are collected and published by Government departments and organizations like the World Health Organization.
If we look at the observed data, we are bound to ask why are they so different between countries? This is most apparent if we look at what are sometimes misleadingly called death rates. One of the most common parameters to measure the deadliness of a disease outbreak is the case-fatality rate (CFR). The CFR represents the confirmed number of deaths of people who were affected by COVID-19 divided by the total number of confirmed cases of infections of COVID-19. For example, a disease with eight deaths out of 100 confirmed cases has a CFR equal to 8 per cent. At this moment (7 April 2020) the CFR is 12.63% in Italy, 11.15% in the UK, 9.89% in Spain and only 1.86% in South Korea. For the death rate or the mortality rate, the denominator is the whole population, infected or not.
What explains these big differences? If we assume that every country counts correctly the deaths linked to COVID-19 (which is the numerator of the CFR), the obvious place to look for an answer is the count of the confirmed positive cases of COVID-19 (which is its denominator). The importance of this number can be illustrated by comparing data from two countries at the extreme ends of the range of values for the national CFR: Italy and South Korea. The chart below gives the positive cases of COVID-19 by age group in these countries at the time when the absolute numbers of the overall confirmed cases were roughly similar (8,036 in Italy vs 7,134 in South Korea). I focus on age since it has been recognized as one of the strongest predictors of mortality in COVID-19. My analysis relies on the statistics published on the Korean news agency and the Italian daily newspaper Corriere della Sera and already considered in other blogs.
Showing the proportion of individuals positive to COVID-19 by age in Italy (blue bars) and in South Korea (red bars), Graph 1 tells an interesting story! Indeed, only 3% of all confirmed cases in South Korea were aged 80 or more, while in Italy this value is equal to 19.1%. And almost 30% of Koreans positive to COVID-19 were between 20 and 29 years old, compared with only 3.7% of Italians with the same age.
Graph 1: Positive cases of coronavirus in Italy and South Korea by age groups.
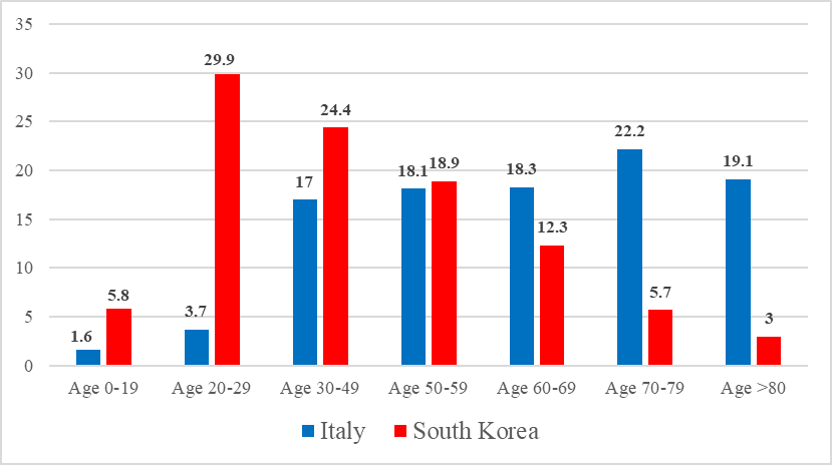
Source: https://medium.com/@andreasbackhausab/coronavirus-why-its-so-deadly-in-italy-c4200a15a7bf Own elaborations
Why do these age distributions look so different in the two countries?
The fact that Italy’s population has an older age structure than Korea’s (Graph 2) is not enough to explain the difference in these age distributions. We should look rather at the way in which the denominator is constructed in the two countries. Who is included in the count of confirmed cases, and how are they being identified? The denominator has an important power since it may include individuals who are asymptomatic as well as those who present some symptoms. It is easier to ensure that most people with severe symptoms (and hospitalized) are included in the official statistics than those with mild symptoms (and self-isolating at home with what may be COVID-19 or the flu or just a heavy cold); and people who have the infection but are asymptomatic are very likely to be hidden altogether from view. However, the current consensus is that most cases are likely to be asymptomatic and they should be included in the analysis in order to obtain a complete picture of the phenomenon.
Italy South Korea
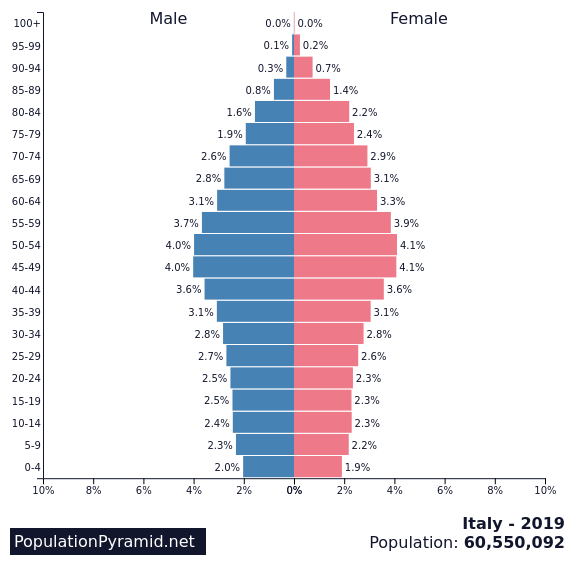
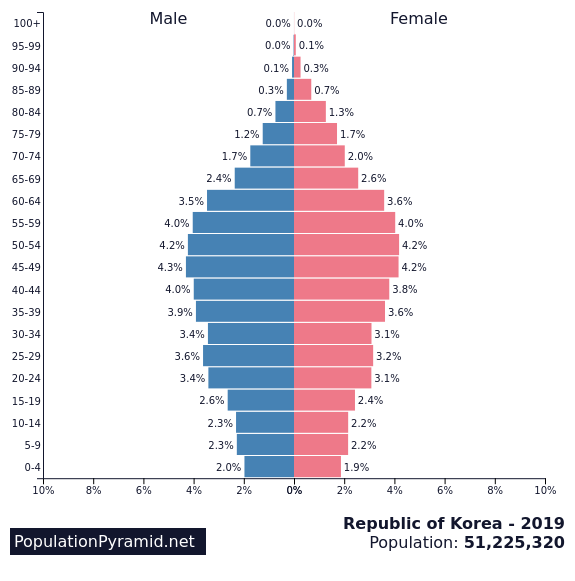
Graph 2: Share of population in Italy and South Korea by age groups.
Source: https://www.populationpyramid.net/italy/2019/ and https://www.populationpyramid.net/republic-of-korea/2019/
Based on what we’ve been told by official sources, the testing strategies have been very different in South Korea and Italy. Italy has mostly been testing people with a symptomatic COVID-19 infection (and often only when they become severe), while South Korea has been testing a large sample of the population, regardless whether they have shown any symptom or not.
Because the number of people with symptoms and the number of deaths are much higher in the old population (and this happens in every country), the results from South Korea suggest that they have detected more asymptomatic cases, and that most of them were among the younger generations. South Korea is not an exception since similar results have been found in the “experiment” rolled out in Vo’, a small town in Italy (pop. 3000). In Vo’, which was the heart of the country’s outbreak, the local authorities decided to test the majority of the population, regardless of whether they had symptoms. This helped them to identify people who were infected even though they were completely asymptomatic. The information was used to impose a rigorous quarantine that seems to have eradicated the virus.
These results obtained from South Korea and Vo’ should lead us to think very hard about population-based testing strategies. The case for a more aggressive testing approach, as the World Health Organization strongly recommended, seems now to be very strong. To increase the coverage of tests might have a crucial role right now as well as in preparations for the near future, when we will probably see a second peak in the speed with which the infection spreads through the population (likely in the second part of 2020). There is of course a major issue with capacity and infrastructure there, and this applies at a national level, let alone internationally. However, doing extensive contact tracing and testing will enable public health authorities to develop surveilling strategies for the population at risk. If this works, it could be additional proof that good data and robust statistical analyses will help us beat this virus and save lives that will otherwise be cut short.
About the Author:
Dr Sara Zella is a Research Fellow at the Oxford Institute of Population Ageing. Sara joined the Institute in 2016 to work with Professor Sarah Harper on the research project “The impact of different work/care life courses on women’s wellbeing and quality of life in early retirement and the welfare regimes which help shape this”.

